


Market depth, also known as the order book, is a measure of the supply and demand for a particular security at various price levels. It represents the number of shares or contracts that are available for trading at different bid and ask prices. By analyzing market depth, traders can gain valuable insights into the liquidity and potential price movements of a security.
Contents
How Market Depth Works?
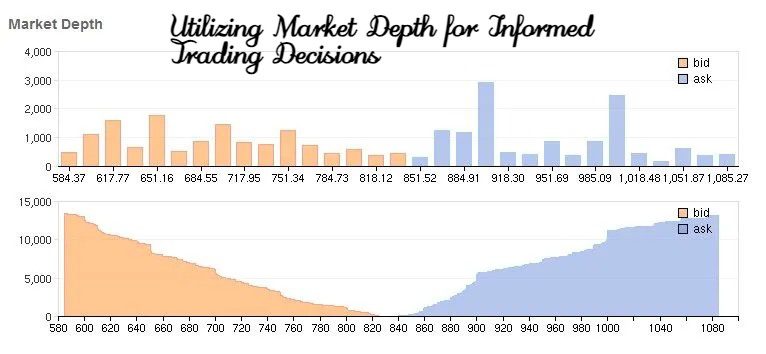
In an electronic trading platform, market depth is displayed as a list of bid and ask prices, along with the corresponding number of shares or contracts available at each price level. The bid price represents the highest price that a buyer is willing to pay for a security, while the ask price represents the lowest price that a seller is willing to accept.
As new orders come in, the market depth updates in real-time, reflecting the current supply and demand for the security. This dynamic nature of market depth allows traders to assess the market sentiment and potential price trends.
Understanding Market Depth for Better Trading Decisions
Market depth is like a map showing the landscape of a financial market. It tells you where traders are placing their buy and sell orders. Understanding this map can help you make smarter trading decisions. But how do you read this map and why is it so important?
Interpreting Market Depth Data
It’s like trying to read tea leaves, but instead of leaves, it’s a bunch of numbers and charts. Exciting, right?
Market depth data is basically a snapshot of the current buy and sell orders for a particular security or asset at varying price levels. It’s like a window into the soul of the market, revealing the supply and demand dynamics at play.
Now, interpreting this data can be a bit tricky. It’s like trying to solve a puzzle where the pieces keep changing. But don’t worry, I’ve got your back! Here are some tips to help you navigate the choppy waters of market depth data:
- Identify the bid and ask prices: The bid price is what buyers are willing to pay for the asset, while the ask price is what sellers are willing to accept. It’s like a tug of war between buyers and sellers and the price is the rope.
- Analyze the quantity of orders: The quantity of buy and sell orders at different price levels can give you an idea of the level of demand and supply in the market. It’s like a popularity contest and the price is the vote.
- Look for patterns: Patterns in the market depth data can help you identify potential support and resistance levels. It’s like looking for constellations in the night sky and the price is the North Star.
- Use the information to make trading decisions: The market depth chart can inform your trading decisions. For example, if there’s a high level of demand for an asset at a particular price level, you might want to buy in anticipation of the price rising. It’s like playing chess and the market depth data is your strategy guide.
Remember, interpreting market depth data is not an exact science. It’s more like reading tea leaves or interpreting dreams. But with practice and a bit of humor, you can become a master of the market depth data. So go forth, brave trader and conquer the market with your newfound knowledge!
Practical Applications
Practical applications of market depth data in trading? You’ve come to the right place, my friend!
Market depth data is like the crystal ball of the trading world. It helps traders to:
- Identify support and resistance levels: By analyzing the order book, traders can spot clusters of buy or sell orders at certain price levels, indicating potential support or resistance areas.
- Gauge order imbalances: A significant imbalance between buy and sell orders can signal a potential price movement in that direction.
- React to news events: During news releases or other market-moving events, traders can use market depth data to quickly gauge market sentiment and react to price fluctuations.
- Understand market liquidity: Market depth data provides a snapshot of the market’s liquidity, helping traders to assess the ease of entering and exiting positions.
- Develop trading strategies: By incorporating market depth data into their trading strategies, traders can make more informed decisions and potentially improve their trading performance.
So, next time you’re staring at a market depth chart, remember that it’s not just a bunch of numbers and lines – it’s your secret weapon for conquering the markets!
Real-World Example
Example 1: Identifying Liquidity in Apple (AAPL) Stock
Suppose you’re considering buying shares of Apple (AAPL) stock. Before placing your order, you decide to analyze the market depth to assess the liquidity of the stock. You observe the following:
| Bid Price | Bid Size | Ask Price | Ask Size |
|---|---|---|---|
| $150.00 | 500 | $150.05 | 300 |
| $149.95 | 800 | $150.10 | 400 |
| $149.90 | 1,200 | $150.15 | 600 |
The market depth shows that there is a significant number of shares available at various bid and ask prices, indicating high liquidity. This suggests that you can likely execute your trade without significantly impacting the price of AAPL stock.
Example 2: Spotting Resistance in EUR/USD Forex Pair
Imagine you’re trading the EUR/USD forex pair and considering placing a buy order. By analyzing the market depth, you notice the following:
| Bid Price | Bid Size | Ask Price | Ask Size |
|---|---|---|---|
| 1.1800 | 10 | 1.1805 | 25 |
| 1.1795 | 15 | 1.1810 | 40 |
| 1.1790 | 20 | 1.1815 | 50 |
The market depth reveals a significant number of sell orders (ask size) at the 1.1815 price level, indicating a potential resistance level. This information suggests that the price may struggle to break above 1.1815, and you may want to consider placing your buy order below this level or waiting for a breakout before entering the trade.
Example 3: Identifying Support in Gold Futures
Let’s say you’re analyzing gold futures and considering placing a sell order. The market depth shows the following:
| Bid Price | Bid Size | Ask Price | Ask Size |
|---|---|---|---|
| $1,800 | 100 | $1,802 | 50 |
| $1,798 | 150 | $1,804 | 30 |
| $1,796 | 200 | $1,806 | 20 |
The market depth indicates a large number of buy orders (bid size) at the $1,796 price level, suggesting a potential support level. This information suggests that the price may find it difficult to fall below $1,796, and you may want to consider placing your sell order above this level or waiting for a breakdown before entering the trade.
In summary, understanding and analyzing market depth can provide a significant edge in trading. It helps you see where the big players are placing their orders and make informed decisions based on this data.
The Impact of Market Depth on Trading Strategies
Market depth provides a detailed picture of supply and demand for a particular asset. This information is crucial for developing effective trading strategies. But how does market depth influence your trading decisions, and how can you leverage it to improve your trading outcomes?
Influence on Trading Decisions
Market depth can significantly impact your trading decisions. It helps you understand the strength and weakness of price levels. For instance, if you see a lot of buy orders at a particular price, it indicates strong demand at that level. This can be a good entry point for buying. Conversely, a large number of sell orders at a higher price level indicates strong resistance, which might be a good point to sell.
Using market depth, traders can avoid entering trades at unfavorable prices. For example, if the market depth shows significant sell orders at a certain level, you might avoid buying until the price moves past that resistance.
Examples of Trading Strategies
One popular strategy enhanced by market depth is scalping. Scalpers look for small price movements and aim to make quick profits. By analyzing market depth, scalpers can identify short-term support and resistance levels. This allows them to enter and exit trades quickly, maximizing their chances of profit.
Another strategy is swing trading, which involves holding positions for several days or weeks. Swing traders can use market depth to identify key levels where the price is likely to reverse. By placing orders near these levels, swing traders can improve their entry and exit points.
- Trend Following: This strategy involves riding the wave of a trend, whether it’s going up or down. Traders using this strategy buy when the trend is up and sell when it’s down. It’s like surfing, but with money!
- Breakout Trading: This strategy involves identifying key levels of support and resistance and then entering a trade when the price breaks through one of these levels. It’s like waiting for the perfect wave to come along and then paddling like crazy to catch it!
- Mean Reversion: This strategy is based on the idea that prices will eventually revert to their mean or average price. Traders using this strategy buy when the price is low and sell when it’s high, expecting it to return to its average. It’s like buying a stock when it’s on sale and then selling it when it’s back to its regular price!
- Scalping: This strategy involves making lots of small trades to capture small price movements. It’s like picking up pennies in front of a steamroller!
- Swing Trading: This strategy involves holding a trade for a few days to a few weeks to capture medium-term price movements. It’s like taking a leisurely stroll through the market!
Case Studies
Case Study 1: The Flash Crash of 2010
On May 6, 2010, the Dow Jones Industrial Average plummeted nearly 1,000 points in a matter of minutes. This event, known as the Flash Crash, was largely attributed to a lack of market depth. As the market experienced a rapid sell-off, the lack of buy orders at lower price levels caused prices to plummet. The lack of liquidity and market depth exacerbated the market volatility, leading to a sharp decline in prices.
Case Study 2: The GameStop Short Squeeze of 2021
In early 2021, a group of retail investors on Reddit’s WallStreetBets forum decided to buy shares of GameStop, a struggling video game retailer. This led to a massive short squeeze, as hedge funds that had bet against GameStop were forced to buy back their shares at a loss. The increased demand for GameStop shares led to a rapid increase in the stock price, which was further exacerbated by the lack of market depth. As the stock price continued to rise, the lack of liquidity made it difficult for market makers to maintain an orderly market.
Case Study 3: The Brexit Vote of 2016
In June 2016, the United Kingdom voted to leave the European Union, a decision that had a significant impact on global financial markets. The uncertainty surrounding the Brexit vote led to a sharp decline in the value of the British pound. The lack of market depth in the currency markets made it difficult for traders to execute large trades, leading to increased volatility and price swings.
Conclusion
Market depth is a powerful tool that can greatly enhance your trading strategies. By providing a clear view of where buy and sell orders are placed, it helps you make more informed trading decisions. Whether you’re a scalper, a swing trader, or any other type of trader, understanding and utilizing market depth can give you a significant edge in the markets. Always remember to combine this with other forms of analysis and keep learning to refine your strategies.